International trade is a direct reflection of the state of the global economy. Trade reveals the appetite for final goods by consumers, as well as the need for intermediate and capital goods by firms. Thus, trade volumes fluctuate in line with the global cycles of economic expansions and contractions, and are highly informative indicators of macroeconomic conditions.
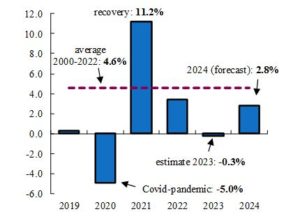
During the last five years, trade has shown remarkable volatility. After the sharp collapse in global trade volumes in 2020 generated by the Covid-pandemic shock, a strong rebound in 2021 was a significant contributing factor to the post-pandemic recovery. However, 2022 brought a sharp deceleration in trade activity amid a challenging environment of rising interest rates, high inflation, and increasing protectionism. Trade growth performance in 2023 was even more disappointing, with the latest preliminary estimates suggesting that it contracted by 0.3%. During the last 40 years, a contraction in trade was only observed in 2009 as a result of the Global Financial Crisis (GFC), and in 2020 with the Covid-pandemic.
Growth in Volume of Global Trade in Goods

(%, year over year)
Source: International Monetary Fund, QNB Economics
In our view, although trade growth will recover to around 2.8% this year, this is significantly below the historical long-run average of 4.6% during 2000-2022. In this article, we discuss the cyclical and structural factors that will restrain the recovery of trade to a pace below the historical average.
First, the global manufacturing recession is reaching its end, but the recovery will be restrained. Throughout 2023, manufacturing activity remained subdued. This “manufacturing recession” was a result of a battery of factors: post-pandemic shift in consumption towards services, higher costs of living, tighter financial conditions, and a weaker than expected rebound in Chinese manufacturing. But these headwinds are now gradually fading, and the manufacturing downturn has reached its trough.
We expect global industrial activity to recover on the back of easier financial conditions, falling inflation, and a resilient global economy. However, the recovery will be held-back by still-elevated inventories, as the de-stocking will weigh on manufacturing until inventory levels are normalized. Additionally, forward looking indicators are still pointing to below-trend growth. Therefore, the recovery in manufacturing will provide only a modest push to global trade growth this year.
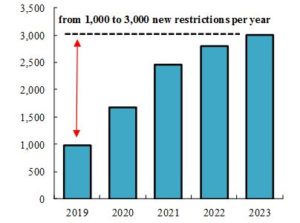
Second, protectionist policies and trade barriers continue to build up steadily at the global scale. The number of new trade restrictions around the world has increased from levels below 1,000 per year before 2019, to over 3,000 new restrictions in 2023. But in addition to traditional forms of restrictions, barriers to trade are beginning to take a new form.
Climate-change mitigation efforts are leading to an increase in non-tariff measures (NTM) that imply new indirect restrictions for trade. NTM grounded on climate-change may include conditions regarding emission standards for machinery and vehicles, energy efficiency regulations, carbon footprint requisites, etc. The United Nations has identified 2,366 climate-related NTM that regulate USD 6.5 trillion worth of trade, or 26.4% of the global total. Each technical measure has an estimated average cost impact of 3.4% in manufacturing. Going forward, the accumulation of trade barriers and new climate-change related trade regulation will represent an important obstacle to the expansion of world commerce.
Number of Trade Restrictions

(new trade restrictions imposed worldwide, per year)
Source: IMF, Global Trade Alert, QNB Economics
Third, the slowdown in investment growth in emerging markets (EM) implies a major headwind to global trade growth. Investment in EM is more import intensive than other components of demand, and in particular with respect to trade in capital goods. In previous years, strong investment growth was supported by robust credit expansion, capital inflows, improvements in terms of trade, and reforms aimed to enhance the investment climate. During 2000-2010, investment growth in EM averaged 9.4%, but then dropped to 4.8% during 2011-2021. This slowdown was extensive across all the EM regions and explained by factors including elevated debt levels, higher economic and geopolitical uncertainty, and China’s rebalancing towards consumption and away from investment and exports. Importantly, we expect this negative trend to persist. Given its critical role for global trade flows, the slowdown in EM investment points to a major headwind for global trade this year.
All in all, although we expect a recovery this year, growth in trade will continue to underperform relative to its long-run average, on the back of a modest manufacturing recovery, rising trade distortions, and the deceleration of EM investment.
What's happening in Tunisia?
Subscribe to our Youtube channel for updates.


